Environmental command view
Environmental Analytics Board
ConductVision turns water cameras and telemetry into reviewable evidence: flood extent, surface activity, outfall events, risk heatmaps, and alert-ready records.
Visual Events
7
Flood, outfall, and context signals
Water Surface
77.0%
Mean visible river coverage
Outfall Signal
34.2%
Pipe wet-surface proxy
Review Zones
4
Spatial heatmap regions
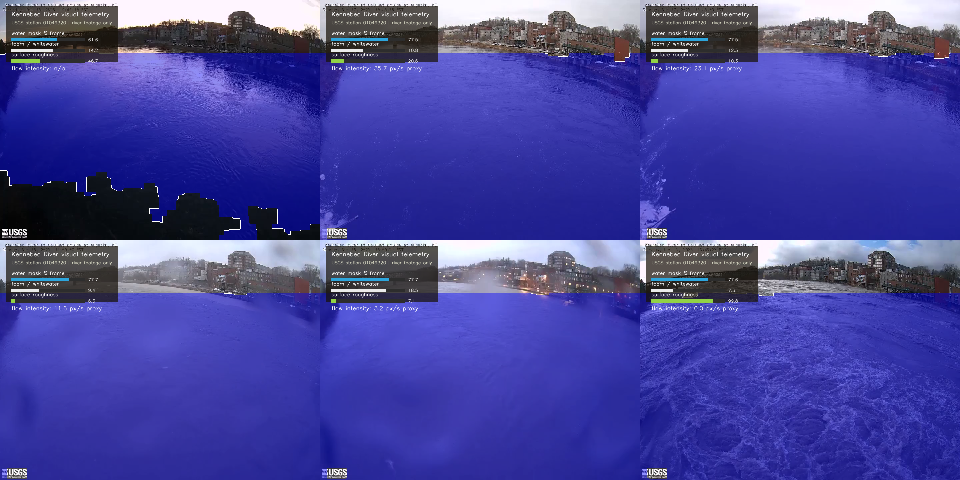
Flood Monitoring
Open77.0% water surface
River footage is converted into water extent, surface roughness, whitewater, and motion telemetry.
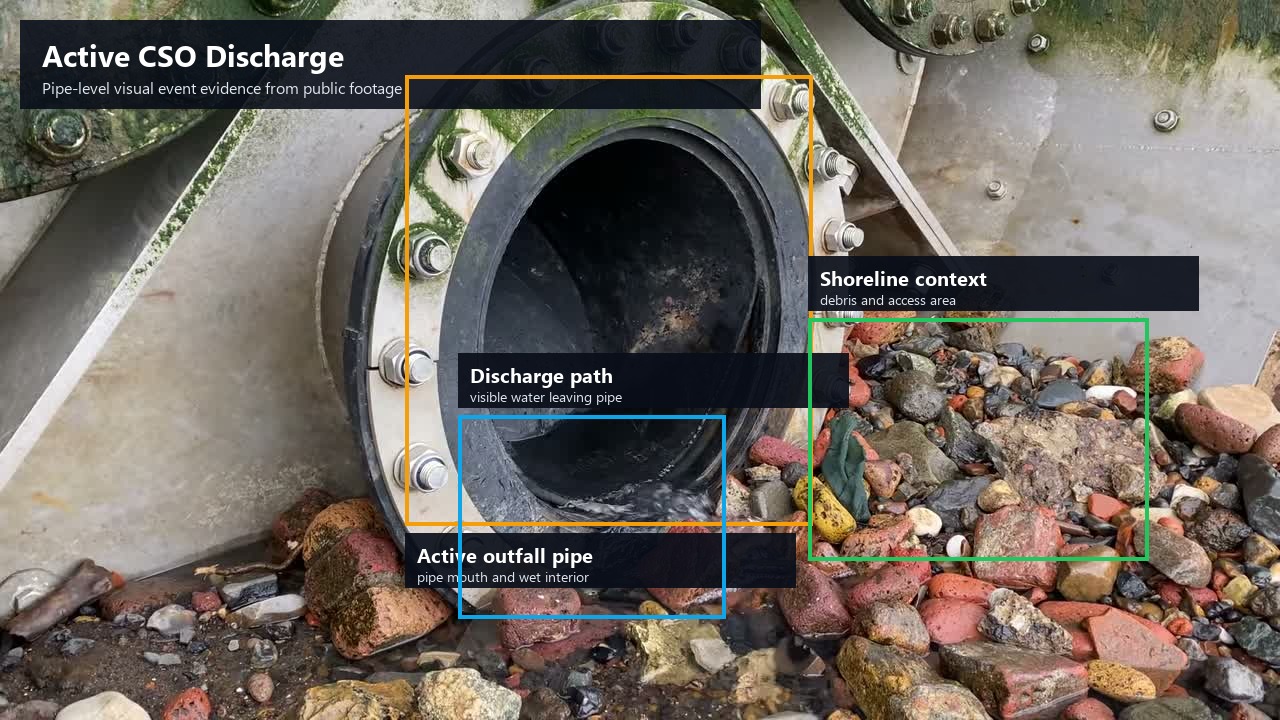
Outfall Events
Open4.5-10.0s discharge window
Public CSO footage is reviewed for active discharge, pipe regions, plume activity, and surface anomalies.
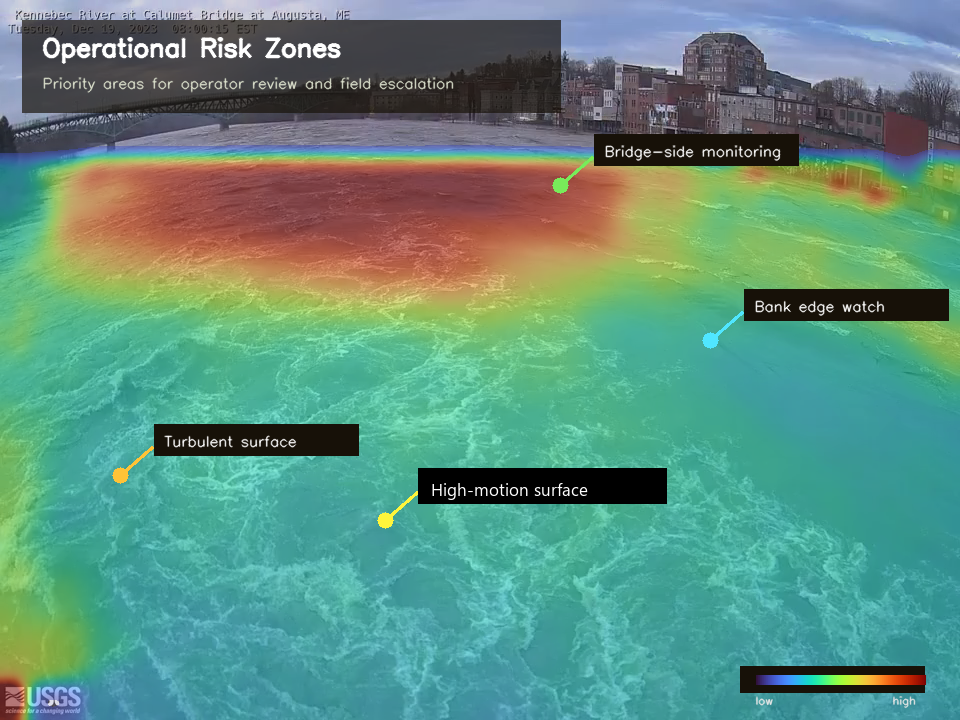
Flood Risk Heatmaps
Open4 review zones
Frame-level signals are aggregated into spatial views that show where operators should look first.
Signal map
What the board is measuring
Each route is a different operator lens on the same idea: pixels become structured evidence.
| Domain | Source | Extracted Signal | View |
|---|---|---|---|
| River stage context | USGS streamgage + river footage | Water extent, roughness, motion | Open |
| Outfall inspection | Public CSO discharge footage | Discharge window, plume ROI, surface anomalies | Open |
| Flood spatial review | Aggregated frame telemetry | High-motion surface and bank-edge watch zones | Open |
| Alert queue | Computer vision events + public telemetry | Warnings, watch signals, and evidence links | Open |
Response Readiness
Visual signals are organized around the decisions operators need to make first: where the water is moving, where risk is concentrating, and which events need review.
Each alert links back to evidence so teams can move from detection to inspection, sampling, or escalation without losing scene context.
Fixed cameras, site geometry, thresholds, and operating rules can tune the board to a specific river, outfall, reservoir, or facility.